This project is inspired from popular CityNerd Youtube channel’s presentation on Farebox Recovery. The main goal of this mini project is to explore, analyze, and interpret transit data from various sources to derive insights into ridership trends, agency performance, and the financial efficiency of transit systems for the year 2022.
The analysis primarily focuses on key financial and operational performance metrics, such as Vehicle Revenue Miles (VRM), Unlinked Passenger Trips (UPT), and Farebox Recovery Ratio (the ratio of total fares to expenses). Additional explorations focus on the most efficient transit modes and the busiest metropolitan areas.
II. Data Preparation
Loading Required Libraries
To begin, we load the necessary R libraries, primarily using the tidyverse package for data wrangling and DT for data visualization.
Code
if (!require("tidyverse")) install.packages("tidyverse")
Loading required package: tidyverse
Warning: package 'ggplot2' was built under R version 4.4.2
── Conflicts ────────────────────────────────────────── tidyverse_conflicts() ──
✖ dplyr::filter() masks stats::filter()
✖ dplyr::lag()    masks stats::lag()
ℹ Use the conflicted package (<http://conflicted.r-lib.org/>) to force all conflicts to become errors
Code
if (!require("DT")) install.packages("DT")
Loading required package: DT
Code
library(tidyverse)library(DT)
Importing Datasets
We imported three main datasets: Fare Revenue (FARES), Operating Expenses (EXPENSES), and Ridership Data (TRIPS, MILES). These were cleaned and filtered to remove irrelevant columns, resulting in a dataset that focuses on total fares, expenses, and VRM/UPT data.
Code
FARES <- readxl::read_xlsx("~/STA9750-2024-FALL/MP-DATA/2022 Fare Revenue.xlsx")EXPENSES <- readr::read_csv("~/STA9750-2024-FALL/MP-DATA/2022_NTD_Annual_Data_-_Operating_Expenses__by_Function__20231102.csv")
Rows: 3744 Columns: 29
── Column specification ────────────────────────────────────────────────────────
Delimiter: ","
chr (10): Agency, City, State, NTD ID, Organization Type, Reporter Type, UZA...
dbl  (2): Report Year, UACE Code
num (10): Primary UZA Population, Agency VOMS, Mode VOMS, Vehicle Operations...
lgl  (7): Vehicle Operations Questionable, Vehicle Maintenance Questionable,...

ℹ Use `spec()` to retrieve the full column specification for this data.
ℹ Specify the column types or set `show_col_types = FALSE` to quiet this message.
After importing the data, several unnecessary columns were dropped to keep the datasets focused on the required metrics (UPT, VRM, Expenses, etc.)
To extract monthly financials such as Total Fares and Expenses for each mode, A new dataset (FINANCIALS) is created by joining Fare Revenue (FARES), Operating Expenses (EXPENSES). It contains (NTD ID, Agency Name , Mode, Total Fares, Expenses)
Code
FARES <- FARES|>select(-`State/Parent NTD ID`, -`Reporter Type`,-`Reporting Module`,-`TOS`,-`Passenger Paid Fares`,-`Organization Paid Fares`) |>filter(`Expense Type`=="Funds Earned During Period") |>select(-`Expense Type`) |>group_by(`NTD ID`, # Sum over different `TOS` for the same `Mode``Agency Name`, # These are direct operated and sub-contracted `Mode`) |># of the same transit modality# Not a big effect in most munis (significant DO# tends to get rid of sub-contractors), but we'll sum# to unify different passenger experiencessummarize(`Total Fares`=sum(`Total Fares`)) |>ungroup()
`summarise()` has grouped output by 'NTD ID', 'Agency Name'. You can override
using the `.groups` argument.
Similarly to extract monthly transits numbers such as Unlinked Passenger Trip and Vehicle Revenue Miles for each agency and mode, a new data set USAGE(USAGE) is created by joining TRIPS (TRIPS) and MILES (MILES). It contains (NTD ID,Agency ,UZA Name,Mode,3 Mode,month,UPT, VRM )
Code
TRIPS <- TRIPS |>filter(`Mode/Type of Service Status`=="Active") |>select(-`Legacy NTD ID`, -`Reporter Type`, -`Mode/Type of Service Status`, -`UACE CD`, -`TOS`) |>pivot_longer(-c(`NTD ID`:`3 Mode`), names_to="month", values_to="UPT") |>drop_na() |>mutate(month=my(month)) # Parse _m_onth _y_ear date specsMILES <- MILES |>filter(`Mode/Type of Service Status`=="Active") |>select(-`Legacy NTD ID`, -`Reporter Type`, -`Mode/Type of Service Status`, -`UACE CD`, -`TOS`) |>pivot_longer(-c(`NTD ID`:`3 Mode`), names_to="month", values_to="VRM") |>drop_na() |>group_by(`NTD ID`, `Agency`, `UZA Name`, `Mode`, `3 Mode`, month) |>summarize(VRM =sum(VRM)) |>ungroup() |>mutate(month=my(month)) # Parse _m_onth _y_ear date specsUSAGE <-inner_join(TRIPS, MILES) |>mutate(`NTD ID`=as.integer(`NTD ID`))
III. Exploratory Data Analysis (EDA)
Sampling and Displaying Data
USAGE
The str(str) function is used to get an overview of the datatypes.
For easier readability, the column names are renamed, for ex: UZA Name can be renamed as metro_area. I have decided to keep UPT and VRM as is since its harder to rename with its full abbreviation.
To get an overview of the ridership data (USAGE), we sampled 1000 records and displayed them using an interactive datatable.
FINANCIALS
Code
str(FINANCIALS)
tibble [1,173 × 5] (S3: tbl_df/tbl/data.frame)
 $ NTD ID     : num [1:1173] 1 1 1 1 1 1 1 1 2 2 ...
 $ Agency Name: chr [1:1173] "King County Department of Metro Transit" "King County Department of Metro Transit" "King County Department of Metro Transit" "King County Department of Metro Transit" ...
 $ Mode       : chr [1:1173] "CB" "DR" "FB" "LR" ...
 $ Total Fares: num [1:1173] 5216912 832327 1715265 29386480 56846337 ...
 $ Expenses   : num [1:1173] 0.00 6.05e+07 8.90e+06 0.00 6.72e+08 ...
For easier readability the Mode is recoded
Here is the overview of the ridership data (FINANCIALS),
Code
FINANCIALS |> DT::datatable()
Task 4
Answering Instructor Specified Questions with dplyr.
A.Vehicle Revenue Miles (VRM) Analysis
VRM refers to Vehicle Revenue Miles.
It is the miles that vehicles are scheduled to or actually travel while in revenue service. (total number of miles traveled by a vehicle while it is in service and generating revenue by transporting passengers. It is used in public transportation and transit systems to measure the productive service a vehicle provides.)
Vehicle revenue miles include: Layover / recovery time
Vehicle revenue miles exclude: Deadhead, Operator training,Vehicle maintenance testing, and Other non-revenue uses of vehicles.
1.Which transit agency had the most total VRM?
By summarizing VRM across transit agencies from 2002 to 2024, (I created a function named table_creation to tables)
The transist Mode (Motor Bus) had the total VRM of (49.45 billion revenue miles)
3.NYC Subway Ridership in May 2024
To analyze ridership on the NYC Subway, we filtered the data for Heavy Rail in May 2024 and retrieved UPT values:
Code
table_creation(USAGE %>%filter(Mode =='Heavy Rail'&str_detect(Agency, "New York City") & month =="2024-05-01") %>%select(Mode,UPT))
The monthly ridership of subway for month of May 2025 is total UPT of (180.46 million)
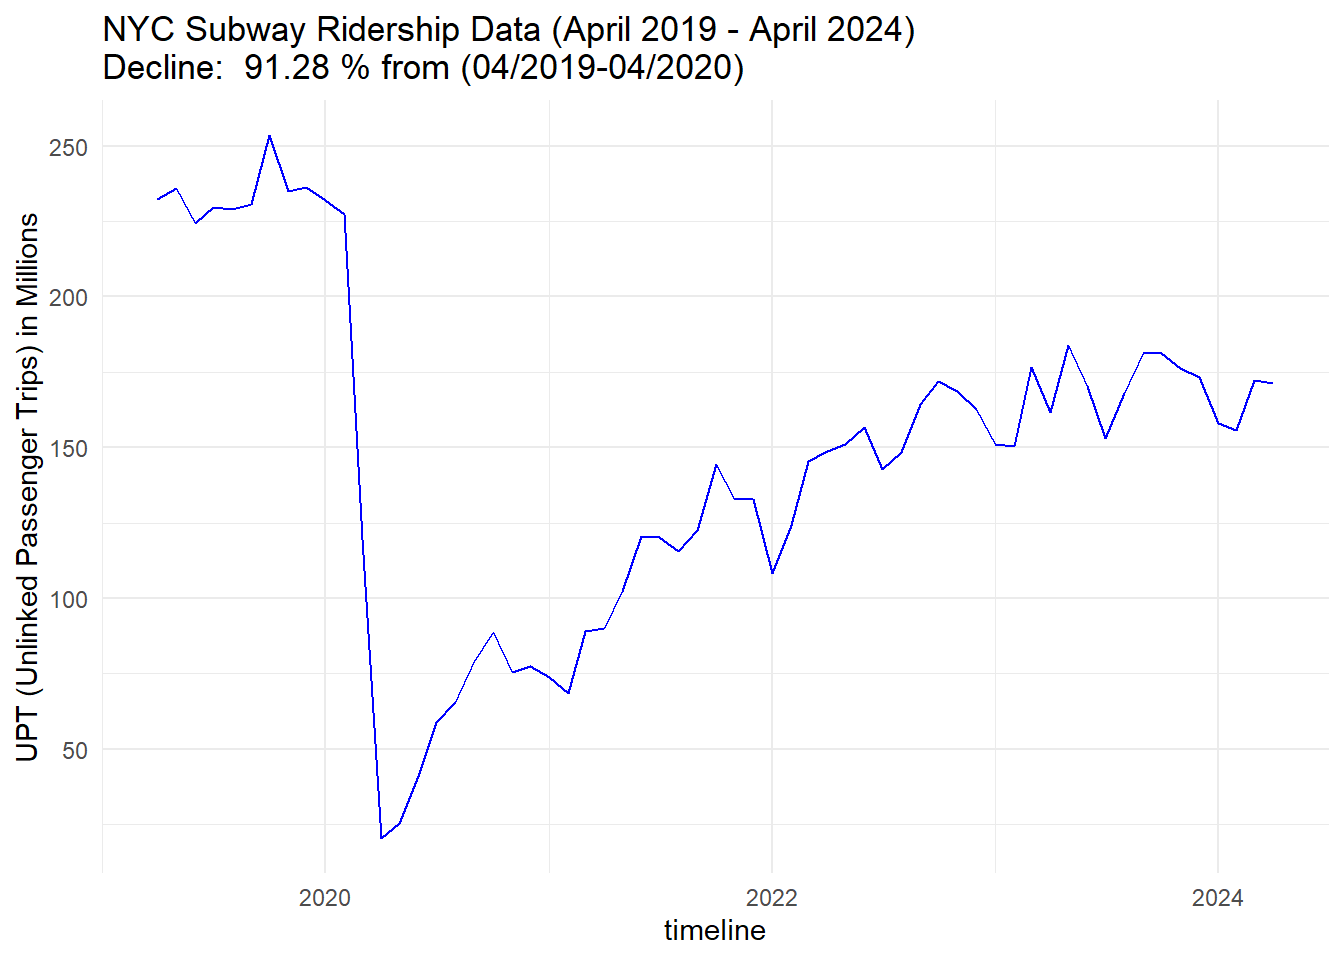
4.NYC Subway Ridership Decline from April 2019 to April 2020
A significant decline in ridership was observed between April 2019 and April 2020. The percentage decline was calculated, and the ridership trend was plotted:
The subway system experienced a 91.28% decline in ridership between April 2019 and April 2020.
However, post-pandemic, ridership has been steadily increasing.However,with the rise of hybrid work culture, monthly UPT rides now show a fluctuating, zigzag pattern.
Questions that I explore by myself
#1. Which are the top 5 metropolitan areas with the highest number of transit agencies?
Code
table_creation(USAGE |>group_by(metro_area)|>summarize(`number of agencies`=length(unique(Agency)))|>arrange(desc(`number of agencies`)) |>slice(1:5))
There are 38 agencies operating in the NY–Jersey City–Newark, NY–NJ metro area and 22 agencies in the Los Angeles–Long Beach, CA region. Let’s focus on the NY–NJ area.
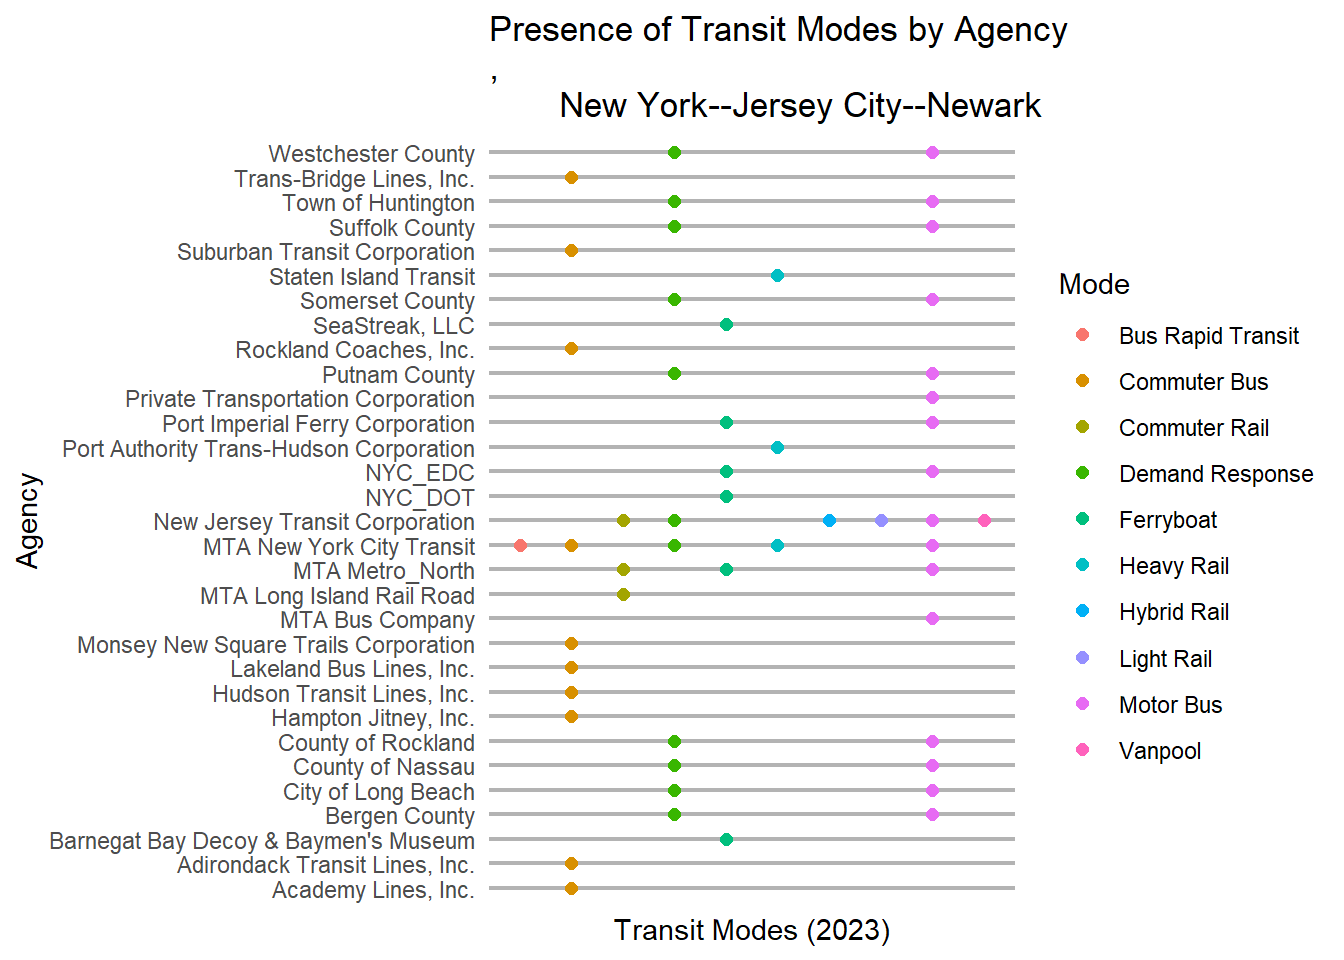
#2 What type of Transist Modes are Offered by Agencies in NY-NJ Metro Area
Most agencies in NY-NJ Metro area offers Bus services. Lets see how is the presence of each mode with in Agencies.
Warning: The `size` argument of `element_line()` is deprecated as of ggplot2 3.4.0.
ℹ Please use the `linewidth` argument instead.
It’s surprising to see that the Vanpool service is exclusively offered by NJT. Given the vastness of the NY-NJ metropolitan area, it would be beneficial to promote Vanpool services similar to how other major cities like the SF-LA area are doing.
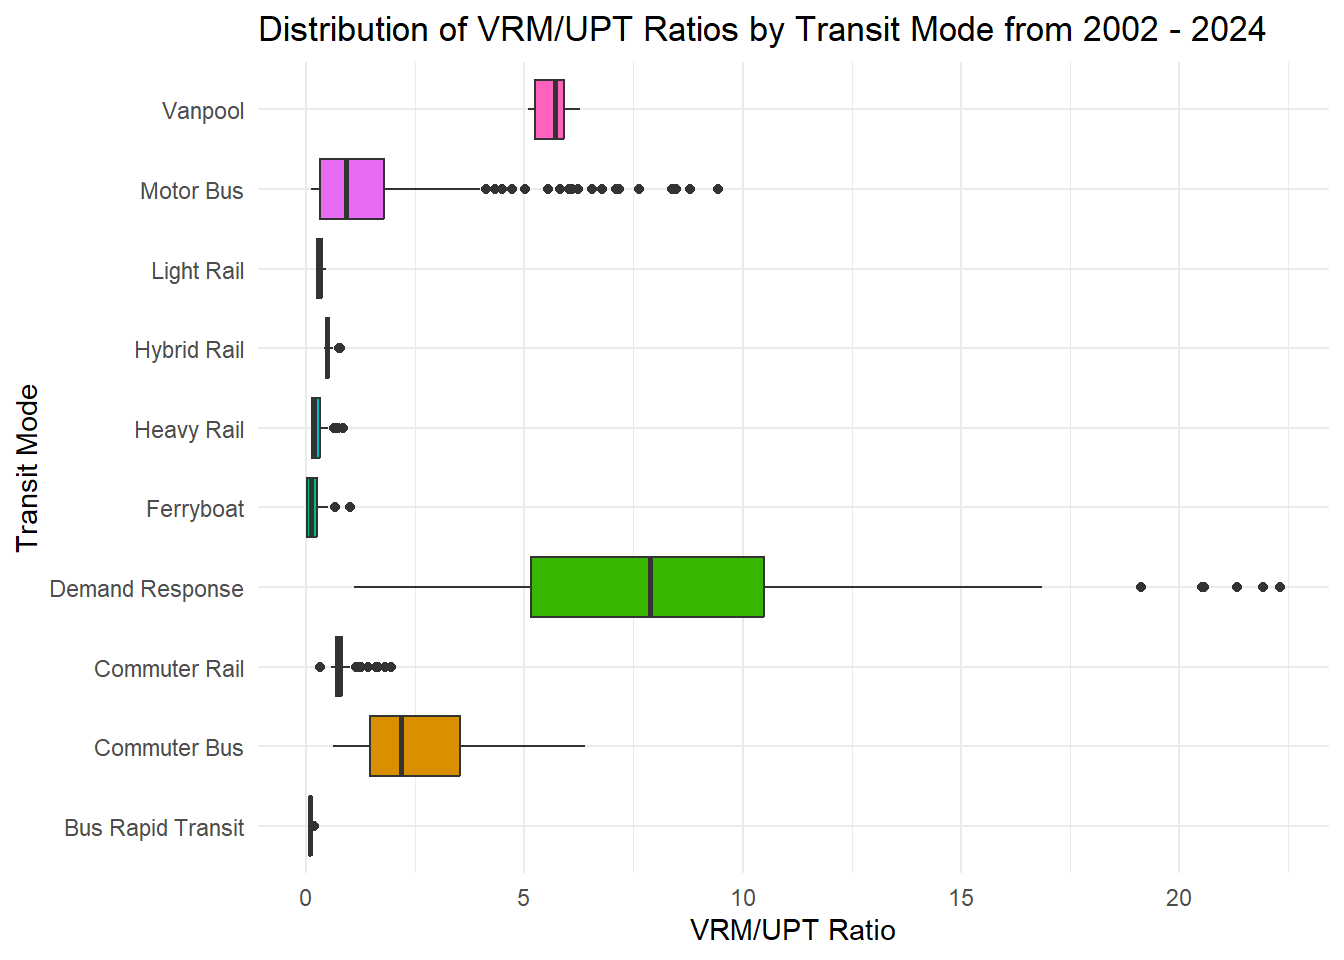
#3 Which Mode of transit achieved the highest Vehicle Revenue Miles (VRM) per trip each year.
The VRM per trip ratio provides valuable insights into agency efficiency. A lower ratio indicates higher vehicle utilization, meaning the agency is transporting more passengers per mile of service. Typically, urban areas tend to have lower VRM per trip ratios compared to rural areas.
To assess the efficiency of agencies in the NY–NJ metropolitan area, we calculated the ratio of VRM to Unlinked Passenger Trips (UPT). This ratio reflects how well transit systems are utilizing their vehicles in relation to passenger demand, with a lower VRM/UPT ratio indicating better efficiency.
#Which Transist Mode is profitable in termns of VRM/UPT Ratio:
## Table for mean of median VRM/UPT ratios for each mode in NY-NJ Metro Area Till 2024
Ferryboat service and heavy rail service has the lowest VRM/UPT ratio after factoring no-agencies contributing to the data, This means those modes have better operational efficiency in terms of ridership relative to miles driven. Since there is only 1 agency contributing to the bus rapid transist, it is hard to determine its universality.
IV. Financial and Usage Data Analysis
Combining USAGE and FINANCIALS
Analysing some data about financial recovery
The USAGE and FINANCIALS datasets were combined, and as a threshold total UPT > 400000 is been taken into consideration.
Code
USAGE_AND_FINANCIALS_top|>DT::datatable()
Farebox Recovery and Cost Efficiency in Transit Systems
1. Transit System with the Highest Farebox Recovery For The Year 2022
Farebox recovery is the ratio of Total Fares to Total Expenses, measuring how effectively fare revenue covers a transit system’s operational costs. It’s crucial for a transit agency to generate enough revenue from passengers to offset its operating expenses. A higher farebox recovery ratio reduces the agency’s reliance on alternative funding sources to keep the transit system running.
Interesting Facts about Port Imperial Ferry’s Role
In 2022, the system with the highest farebox recovery ratio was the Port Imperial Ferry Corporation.
Prime Location: Port Imperial terminal, located in Weehawken, New Jersey, connects commuters from New Jersey’s Hudson River waterfront to key locations in Manhattan. It is a crucial transportation link, especially for daily commuters.
Intermodal Hub: It is also part of an intermodal hub, with connections to New Jersey Transit’s Hudson-Bergen Light Rail. This makes it easier for commuters to switch transit modes, enhancing the system’s convenience.
Time-Saving Option: Their primary customers are daily commuters as it is often faster than other transit modes during rush hours, avoiding heavy traffic on bridges and tunnels, making it a preferred option for those seeking efficiency.
Summary: Port Imperial Ferry’s high farebox recovery is driven by its limited competition, strategic docking agreements, loyal commuter base, and efficient cost management, allowing the service to generate significant revenue relative to its operational costs.
2. Transit System with the Lowest Expenses per Unlinked Passenger Trip (UPT)
Expenses per UPT measure the cost efficiency of a transit system, indicating how much the agency spends to serve per unlinked passenger trip.
Agency:North Carolina State University Mode:Motor Bus Expenses per UPT:1.18 $/ride
Why NCSU’s Motorbus System is Profitable?
Campus Size: North Carolina State University’s main campus spans over 2,000 acres. This vast area creates the need for an internal transportation network to efficiently connect different parts of the university.
Transportation Master Plan: NCSU has a well-structured Transportation Master Plan aimed at improving and optimizing its transportation network. This plan includes strategies to enhance route efficiency, reduce congestion, and ensure the system meets the growing demands of the campus population.
Institutional Support and Subsidies: NCSU likely subsidizes a portion of the motor bus system’s operating costs, which helps keep operational expenses lower. University funding or student fees may cover some costs, reducing the financial burden on passengers while keeping fares affordable, if not free.
High Ridership: With a high volume of students and staff commuting daily, the system benefits from economies of scale. High passenger volume distributes operational costs across more riders, making the cost per trip lower, and ensuring the bus system operates efficiently.
Focused Cost Management: NCSU’s internal control over the transportation system allows for focused cost management. With optimized vehicle maintenance, route planning, and operational schedules, the motor bus system is kept cost-efficient, ensuring its financial sustainability.
Summary: NCSU’s motor bus system is profitable due to the combination of a large and spread-out campus, optimized and efficient route planning, institutional subsidies, and high ridership levels. This strategic approach, combined with NCSU’s Transportation Master Plan, ensures that the system operates at a low cost, making it not only cost-efficient but also potentially profitable.
3. Transit System with the Highest Total Fares per UPT
The highest total fares per UPT indicate the system that generates the most fare revenue per passenger trip.
Agency:Hampton Jitney, Inc Mode:Commuter Bus Fares per UPT:41.3 $/mile
Hampton Jitney is a commuter bus company. Their Three primary routes from the east end of Long Island (The Hamptons and the North Fork) to New York City. Hampton Jitney also operates charter and tour services, along with local transit bus service in eastern Suffolk County under contract with Suffolk County Transit.
Why Hampton Jitney, Inc. has the highest fare per UPT?
Wealthy Customer Base : The Hampton Jitney serves affluent passengers traveling between New York City and the Hamptons, a popular destination for wealthy individuals. These passengers are generally less sensitive to price and are willing to pay premium fares for a convenient, comfortable ride.
Private Agency : As a private transportation service, Hampton Jitney is not bound by government fare controls or subsidies. This allows the agency to charge market-based fares that reflect the demand and exclusive nature of the service.
Premium Service : The Hampton Jitney offers luxury features such as comfortable seating, Wi-Fi, and direct routes, which justify the higher fare prices. Customers are paying not just for transportation, but for an upscale, stress-free experience.
Convenient and Direct Routes: The bus service offers direct transportation from Manhattan to the Hamptons, saving passengers the hassle of driving or taking multiple transfers on public transportation. This convenience is a major factor in the willingness of passengers to pay higher fares.
Seasonal Demand: The Hamptons is a popular summer destination, and during peak seasons, demand for transportation to and from the area skyrockets. Hampton Jitney can charge premium fares during these high-demand periods, further increasing their fare per UPT.
Conclusion: Hampton Jitney’s high fare per ride is driven by its affluent customer base, premium service offerings, convenient routes, and its ability to charge market-driven prices as a private agency. The high fare reflects the value that customers place on convenience and comfort, particularly when traveling to a luxury destination like the Hamptons.
4. Transit System with the Lowest Expenses per Vehicle Revenue Mile (VRM)
This metric shows the agency that operates most efficiently in terms of expenses for each mile their vehicles are in service.
Agency:Metropolitan Transportation Commission Mode:Vanpool Expenses per VRM:0.445 $/mile
**Metro-Area*:** San Francisco--Oakland, CA
The Bay Area Vanpool Program, managed by the MTC, supports groups of 7 to 15 commuters traveling together with an unpaid driver.
According to the Berkleyside, Casual Carpool was a Bay Area tradition before COVID. Post Covid, longtime riders and drivers who want to revive casual carpool are finding it difficult to reestablish the famously organic tradition. But since many people are returning to work and seeking efficient ways to travel, and it’s interesting to observe that there’s a slow resurgence of this informal carpooling tradition.
Why MTC’S Vanpool reduce expenses per Vehicle Revenue Mile (VRM)?
Cost-Effective Commute : Vanpooling is often more economical than driving alone, with participants sharing the costs of fuel, tolls, and maintenance. This can lead to significant savings for commuters.
Sustainable Way : By reducing the number of single-occupancy vehicles on the road, vanpools help decrease traffic congestion and lower greenhouse gas emissions, contributing to a more sustainable environment.
Vanpool Rewards : The MTC actively promotes vanpooling as part of its broader strategy to enhance public transportation options and reduce reliance on individual car travel. Each counties provides different benefits including pre-tax benefits, discounted parking permits and subsidies for commuter vanpoolers
5. Transit System with the Highest Total Fares per VRM
The highest total fares per VRM represent the system that generates the most fare revenue for each mile that its vehicles are in service.
Agency:Jacksonville Transportation Authority Mode:Ferryboat Fares per VRM:157.70 $/mile
The St. Johns River Ferry is an important transportation link, providing service across the St. Johns River and facilitating commuter travel.
V. What do you believe to be the most efficient transit system in the country?
In my view, the most efficient transit system is one that prioritizes the needs of the community rather than focusing solely on generating revenue. Such a system aims to provide reliable and accessible transportation options that serve the public effectively. Among the various transit modes analyzed, I find ferryboats to be particularly efficient, especially in terms of their overall Vehicle Revenue Miles (VRM) to Unlinked Passenger Trips (UPT) ratio. This efficiency indicates that ferryboats are capable of serving a substantial number of passengers relative to the distance traveled, making them a viable option for enhancing urban mobility.
Additionally, when considering cost-effectiveness and environmental sustainability, the Vanpool mode emerges as the best option. Vanpools not only reduce operational costs but also contribute positively to the environment by minimizing the number of individual vehicles on the road. By consolidating passengers into fewer vehicles, Vanpools can significantly decrease carbon emissions and traffic congestion, promoting a greener transit solution.
Ultimately, an efficient transit system should not merely aim for financial gain but should instead focus on fulfilling the transportation needs of its users while fostering sustainable practices. By investing in transit options like ferryboats and Vanpools, cities can create a more effective and environmentally friendly transportation network that benefits both the community and the planet.
VI. Appendix
Additional data and visualizations can be provided upon request, including full code listings and intermediate data tables.